
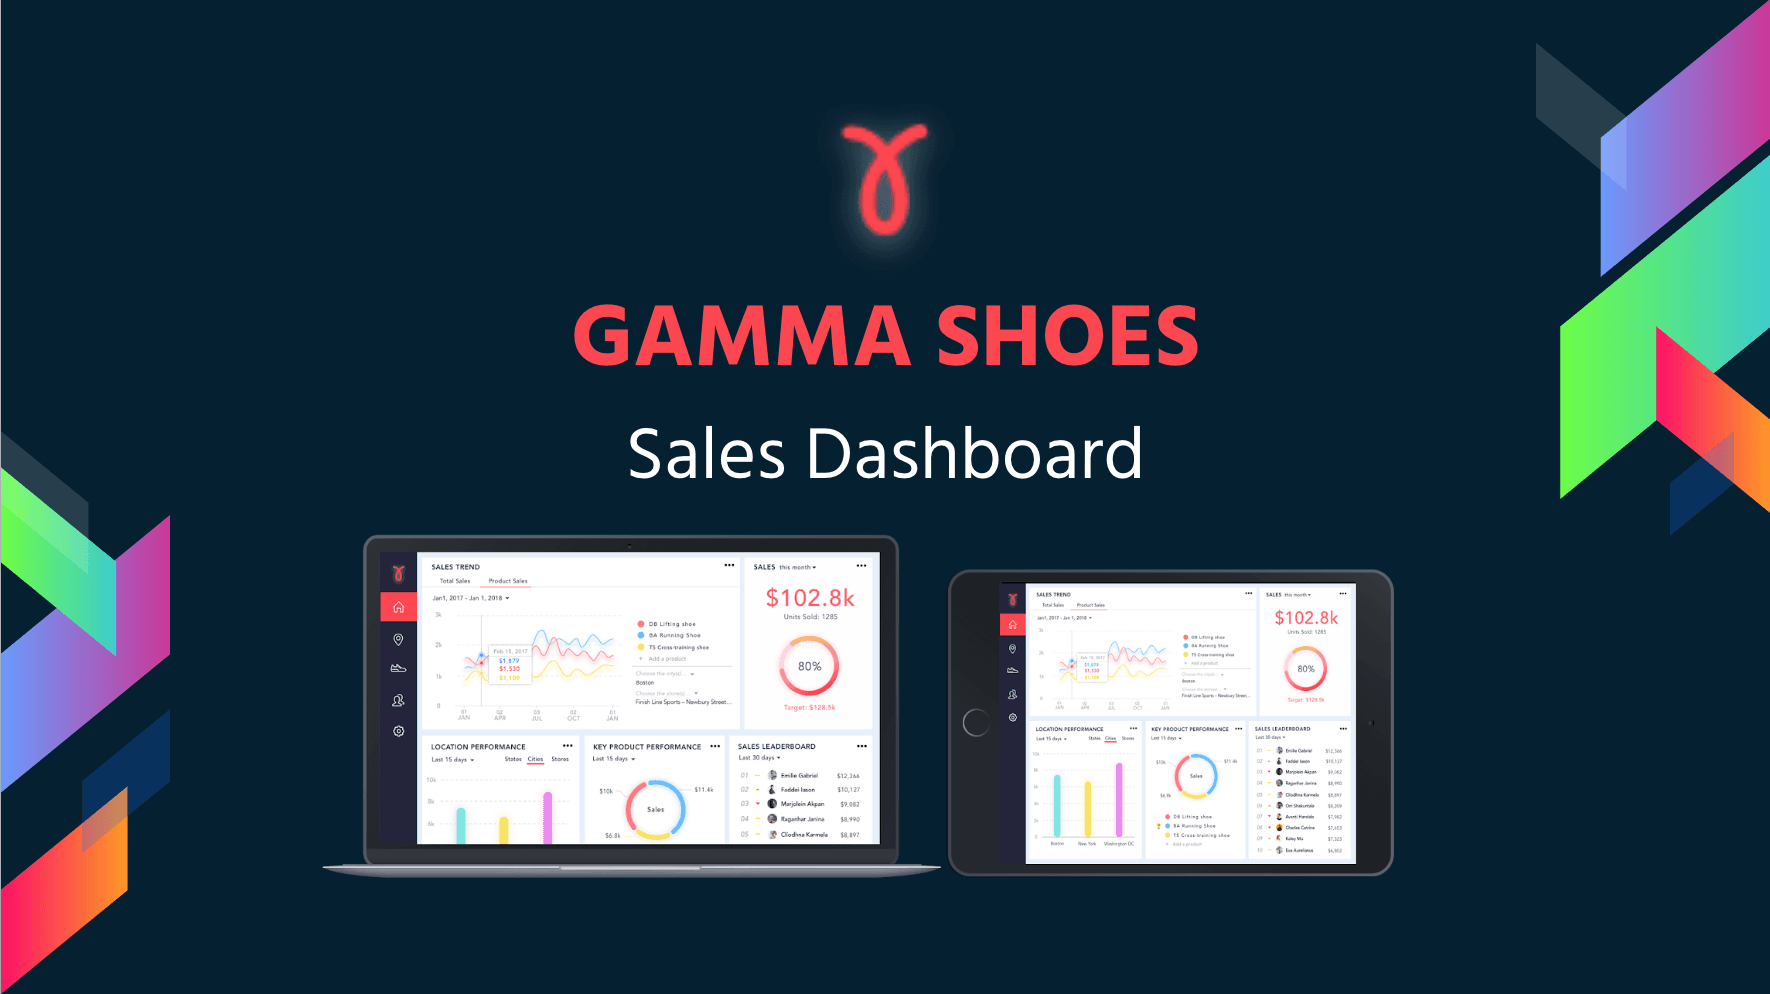
GAMMA SHOES
UX DESIGN | DASHBOARD DESIGN

UX Design | UI Design | Dashboard Design
Duration: 3 days
This is a UX design challenge project I did for MicroStrategy, a company that provides business intelligence, mobile software, and cloud-based services. In this project, I designed a sales analysis dashboard for an upcoming retailer named Gamma Shoes, who is specializing in extreme athletic wear. The dashboard is to allow the company's sales executives, as well as finance, to review the performance of 3 key product lines across the US.

- Design a dashboard (can be applied to both tablet and web applications) to help Gamma Shoes’ sales executives and finance to review the performance of their 3 key product lines across the US.
- Solve the following user needs for the clients:
- Show the total sales for products, cities and stores.
- Help the clients to determine sales for a single type of shoe at one or many stores.
- Help the clients to see sales trends for shoes by location, as well as overall sales trends for a given city or store.
- Show which sales associates are selling the most shoes.
- Help the clients to determine which shoe models they need to order more of.

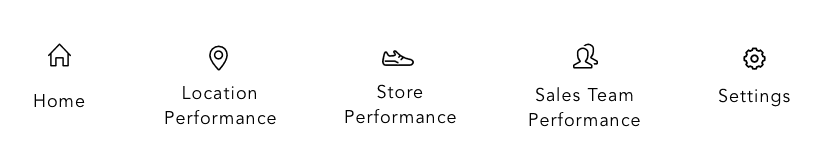
I divided the solutions into five main pages: “Home”, “Location Performance”, “Store Performance”, “Sales Team Performance”, and “settings”. The user can basically see their needs in the home page, and see more details in the other three pages. I did this because I don’t want everything squeezed in one page, which might make the clients feel that the dashboard has no primary or secondary.
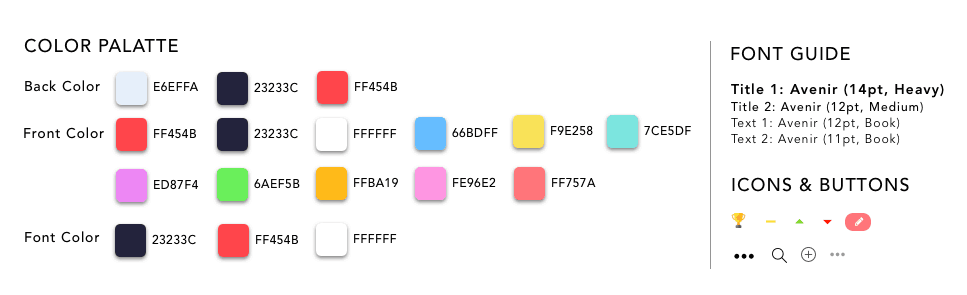
Design System
Design Details
HOMEPAGE
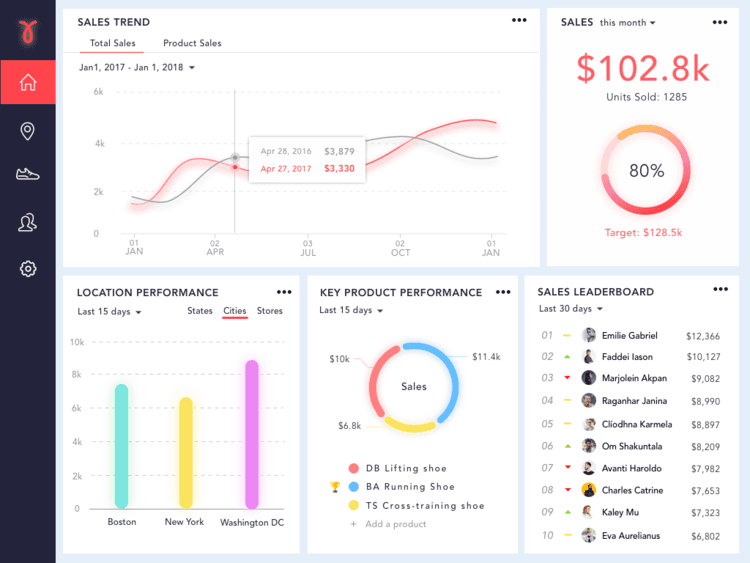

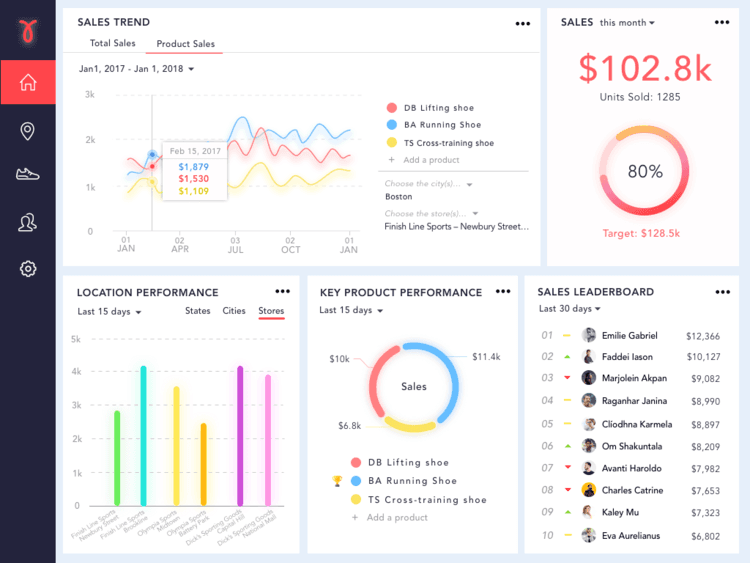
The home page the user will see when they open the dashboard. They will get an overview of the total sales trend, total sales number, location performance, key product performance, and sales leaderboard. If the user wants more detailed data, they can move to the detail performance pages.
Sales Trend
- Total Sales Trend
- The total sales trend shows the sales performance for the whole company in different time frames.
- When the user taps on the line, there will be a small window pop out to show the sales data for that day and a previous date based on the time frame the user has chosen.
- Product Sales Trend
- This part shows the sales trend of the three key products.
- The user can determine sales for a product or several products at one or many stores by choosing the city/store in the filter here. Since Gamma Shoes might have more products, the user can add any available products to compare here if they need.
Total Sales
- The user can see the total sales number, units sold, and percentage to reach the target sales in the different time frame
Location Performance
- The user can see the comparisons of sales among different states, cities, and stores in different time frames.
- If the user taps on the bar, they can see the detailed data of certain states/cities/stores.
- A similar color scheme is used to present the stores in the same city so that the user can do the comparison easier.
Key Product Performance
- The user can know which key product has better sales compared with the other two in the pie chart.
- There would be a trophy beside the name of the product to indicate the one that has the best performance.
- The user can add a new product to compare if they need it.
Sales Leaderboard
- The user can see which sales associate performs the best and how many sales they have in different time frames.
- By looking at the rank change icons, the user can see whether certain sales associate has improvements or fallen behind compared to the last time.
LOCATION PERFORMANCE PAGE
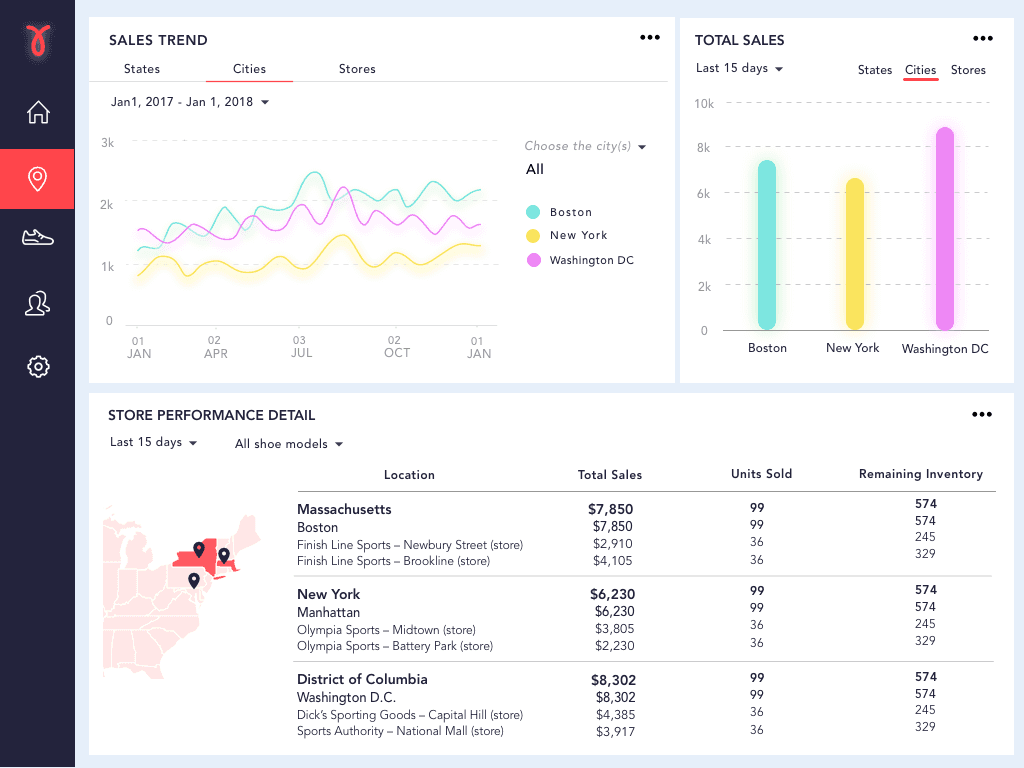
Sales Trend & Total Sales
- The user can see the sales trend and total sales comparison in different states, cities, and stores on the home page.
Store Performance Detail
- There would be more detailed data in this table. For example, the total sales, units sold, and remaining inventory. If users want to see a particular product’s performance in these locations, they can choose the shoe model in the filter.
PRODUCT PERFORMANCE PAGE
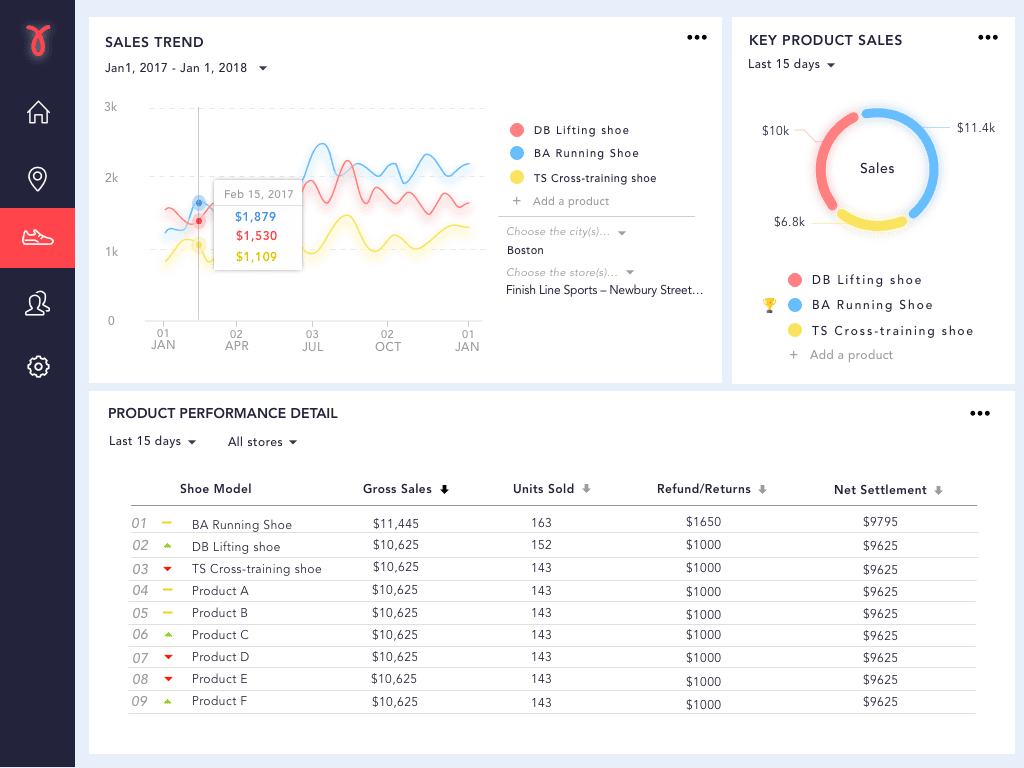
Sales Trend & Key Product Sales
- The user can see the sales trend and key product sales on the home page, and they can also see the table with more detailed data.
Product Performance Detail
- The user can choose a different category to get the rank of the products.
- If they want to see certain stores’ data, they can choose the stores in the filter.
SALES TEAM PERFORMANCE PAGE
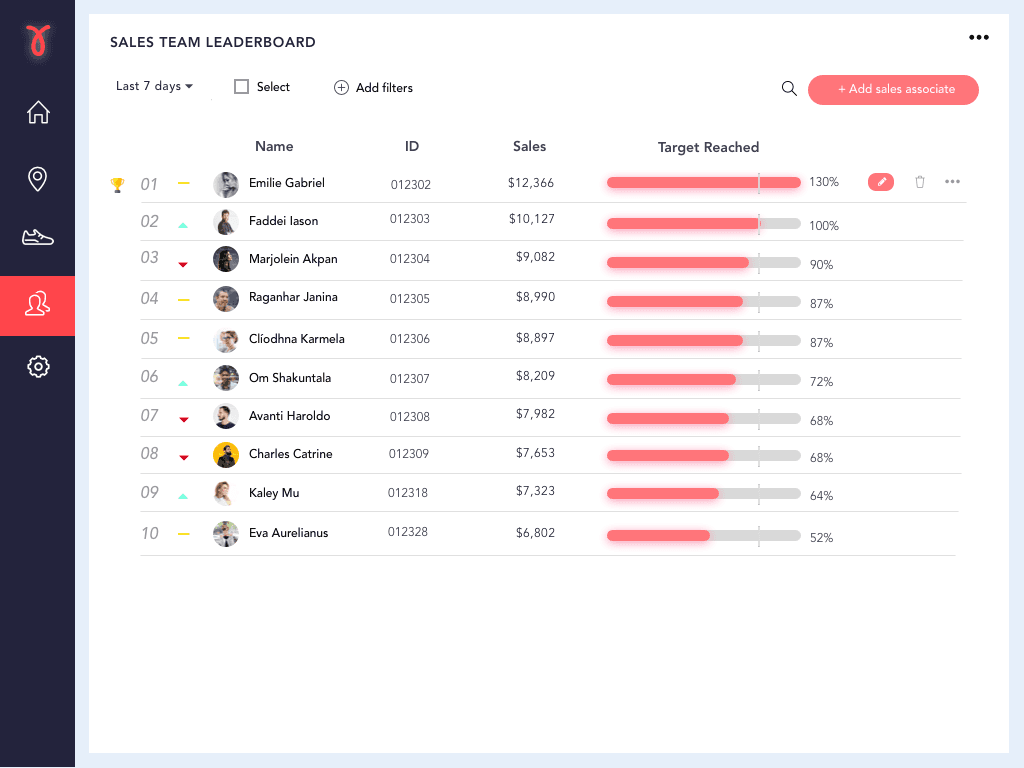
Sales Team Leaderboard
- The user can get a more detailed view than on the home page. They can see the rank, name, id, sales, and percentage of targets they have reached. It’s also very easy to edit the sales associates’ information on this page.